Status of any Capture or Apply Processes
This command is used to show the status of either a single Capture or an Apply Process or a group of either Capture, or Apply Processes or all configured Processes. The default is to show the status of every Process that is running, if no additional parameters are specified.
CLI Syntax:
repcli status process=apply|capture id=processIDThe input parameters are:
- process – The apply value for Apply Processes or the capture value for Capture Processes
- id – The identifier of the Process
The output parameters are:
- Process – Name of the configured Process, possible values are:
- capture
- apply
- ID – The identifier of the Process
- Parameters – The list of the currently configured parameters:
- Name – name of a Capture Process (only for Capture Processes)
- CaptureName – name of Capture Process being used by the Apply Process (only for Apply Processes)
- Server – Host name or IP address of the database server
- Port – Database port
- DBname – Database name
- Command – The last executed command on the listed Process, possible values are:
- INITIALISED – means that the Process exists but currently has no command executed
- RUN – means that the Process is running
- STOP – means that the Process is stopping
- RESET – means that the Apply Process is resetting to the specified LSN
- CommandStatus – Status of the command, possible values are:
- Waiting for the Next Command
- Processing the Transactions
- Waiting for Transactions
- Loading the Data
- CommandStartTime – Time in UTC format when the command was initialized (the parameter is available only in JSON response)
- LastActivityTime – Time in UTC format when the Process activity changed (the parameter is available only in JSON response)
- StartLSN – The first LSN (in hexadecimal format) when a transaction was processed (in repcli the parameter is displayed in the “Total since” section)
- StartLSNTime – Time of the transaction in UTC format the Process has started with (in repcli the parameter is displayed in the “Total since” section)
- CheckpointLSN – The LSN (in hexadecimal format) of the last transaction that has been successfully processed (in repcli the parameter is displayed in the “Last Captured/Applied DB Change” section)
- CheckpointLSNTime – Time in UTC format of the last transaction that has been successfully processed (in repcli the parameter is displayed in the “Last Captured/Applied DB Change” section)
- LastDBLSN – The last known transaction LSN (in hexadecimal format) in the Source Database. The parameter is provided by Capture Process and valid only in the case the Capture Process is running (in repcli the parameter is displayed in the “Last Sourced DB Change” section)
- LastDBLSNTime – Time in UTC format of the last known transaction LSN in the Source Database. The parameter is provided by Capture Process and valid only in the case the Capture Process is running (in repcli the parameter is displayed in the “Last Sourced DB Change” section)
- WAITING – Number of nanoseconds that the Process has been waiting for data to process (in repcli the parameter is displayed in the “Waiting for Transactions” section in HH:MM:SS.FFF format)
- PROCESSING – Number of nanoseconds that the Process has been processing the data (in repcli the parameter is displayed in the “Processing the Transactions” section in HH:MM:SS.FFF format)
- LOADING – Number of nanoseconds that the Process has been loading the data (in repcli the parameter is displayed in the “Loading the Data” section in HH:MM:SS.FFF format)
- Message – Details of the command execution
- CNTD – Number of Delete Operations currently performed by the Process (in repcli the parameter is displayed in the “Transactions” section on “Delete” position)
- CNTI – Number of Insert Operations currently performed by the Process (in repcli the parameter is displayed in the “Transactions” section on “Insert” position)
- CNTU – Number of Update Operations currently performed by the Process (in repcli the parameter is displayed in the “Transactions” section on “Update” position)
- CNTDDL – Number of DDL statements currently processed by the Process (in repcli the parameter is displayed in the “Transactions” section on “DDL” position)
- CNTLOBJ – Number of Objects currently processed by Initial Loading (in repcli the parameter is displayed in the “Loaded Objects” section)
- CNTLOBJREC – Number of records currently processed by Initial Loading (in repcli the parameter is displayed in the “Loaded Objects” section on “Rows” position)
- CNTTX – Number of transactions currently processed by the Process (in repcli the parameter is displayed in the “Transactions” section)
The AverageSpeed parameter is average number of records processed per second (calculated value).
The Lag parameter is the latency (delay) between the last record processed and the timestamp of the last transaction in Source Database - calculated value. The Lag is valid only in the case that the corresponding Capture Process is running. In repcli it is displayed in HH:MM:SS.FFF format.
REST API:
- Endpoint: https://repstance_url/control/process
- Method: POST
- Header:
- Content-Type: application/json
- X-Token: token
- Body:
{
"command": "status",
"parameters": [
["process","apply|capture"],
["id","processID"]
]
}
Server response:
- HTTP Status – Status of the command, possible codes are:
- 200 – if no error occurs
- 422 – if error occurs
- Body:
[
{
"Process":"capture|apply",
"ID":processID,
"Parameters":{
"Name|CaptureName":"captureName",
"Server":"databaseHost",
"Port":"databasePort",
"DBname":"databaseName"},
"Command":"INITIALISED|RUN|STOP|RESET",
"CommandStatus":"Completed|In Process|Failed",
"StatusDetails":"Waiting for the Next Command|
Processing the Transactions|
Waiting for Transactions",
"CommandStartTime":"Time_in_UTC",
"LastActivityTime":"Time_in_UTC",
"StartLSN":"LSN",
"StartLSNTime":"Time_in_UTC",
"CheckpointLSN":"LSN",
"CheckpointLSNTime":"Time_in_UTC",
"LastDBLSN":"LSN",
"LastDBLSNTime":"Time_in_UTC",
"WAITING":"time_in_nanoseconds",
"PROCESSING":"time_in_nanoseconds",
"LOADING":"time_in_nanoseconds",
"Message":"The command execution details",
"CNTD":"Number_of_deletes",
"CNTI":"Number_of_inserts",
"CNTU":"Number_of_updates",
"CNTDDL":"Number_of_ddls",
"CNTLOBJ":"Number_of_loaded_objects",
"CNTLOBJREC":"Number_of_loaded_records",
"CNTTX":"Number_of_transactions"
},
{
Next_Process_description
}, ...
]
The following example shows statuses of all existing Processes:
[http://localhost :8796/] repcli>status
Capture Process 1, Name: repv1, DB: mcdb, Server: source.repstance.com
  RUN (In Process), Waiting for Transactions
    Last Source DB Change : 2019/03/10 21:47:00.610 UTC (0x000000E300001A750004)
    Last Captured DB Change : 2019/03/10 21:47:00.610 UTC (0x000000E300001A750004)
  Total since 2019/03/10 21:43:00.367 UTC (0x000000D400000A850004):
    Processing the Transactions : 00:00:02.214
    Waiting for Transactions : 00:04:00.565
    Average Speed (ops) : 45168.973
    Transactions : 12 (DDL: 2, Delete: 4, Insert: 100016, Update: 0)
Apply Process 1, Transactions Provider (Capture): repv1, DB: mcdb, Server: target.repstance.com
  RUN (In Process), Waiting for Transactions
    Last Source DB Change : 2019/03/10 21:47:00.610 UTC (0x000000E300001A750004)
    Last Applied DB Change : 2019/03/10 21:47:00.610 UTC (0x000000E300001A750004)
    Lag : 00:00:00.000
  Total since 2019/03/10 21:44:00.696 UTC (0x00000000000000000001):
    Processing the Transactions : 00:00:09.230
    Waiting for Transactions : 00:03:23.067
    Average Speed (ops) : 10836.252
    Transactions : 12 (DDL: 2, Delete: 4, Insert: 100016, Update: 0)
The following example shows status of Capture Processes:
[http://localhost :8796/] repcli>status process=capture
Capture Process 1, Name: cap1, DB: prod1, Server: source.repstance.com
  RUN (In Process), Waiting for Transactions
    Last Source DB Change : 2019/03/05 19:58:00.283 UTC (0x0000006F00004C900004)
    Last Captured DB Change : 2019/03/05 19:58:31.103 UTC (0x0000006F00005C340003)
  Total since 2019/03/05 19:58:00.283 UTC (0x0000006F00004C900004):
    Processing the Transactions : 00:00:00.588
    Waiting for Transactions : 00:00:01.165
    Loading the Data : 00:00:04.926
    Average Load Speed (ops) : 190907.891
    Average Speed (ops) : 0.000
    Transactions : 0 (DDL: 0, Delete: 0, Insert: 0, Update: 0)
    Loaded Objects : 2 (Rows: 940416)
Web UI
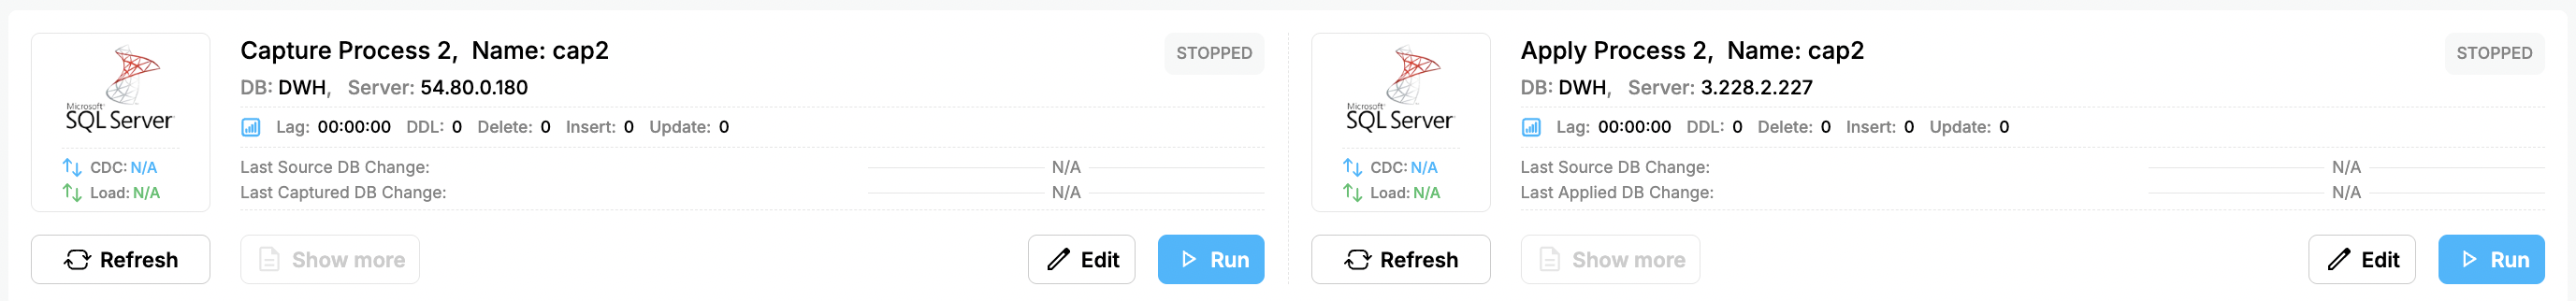
In the Web UI Repstance all the processes are presented on the main dashboard:
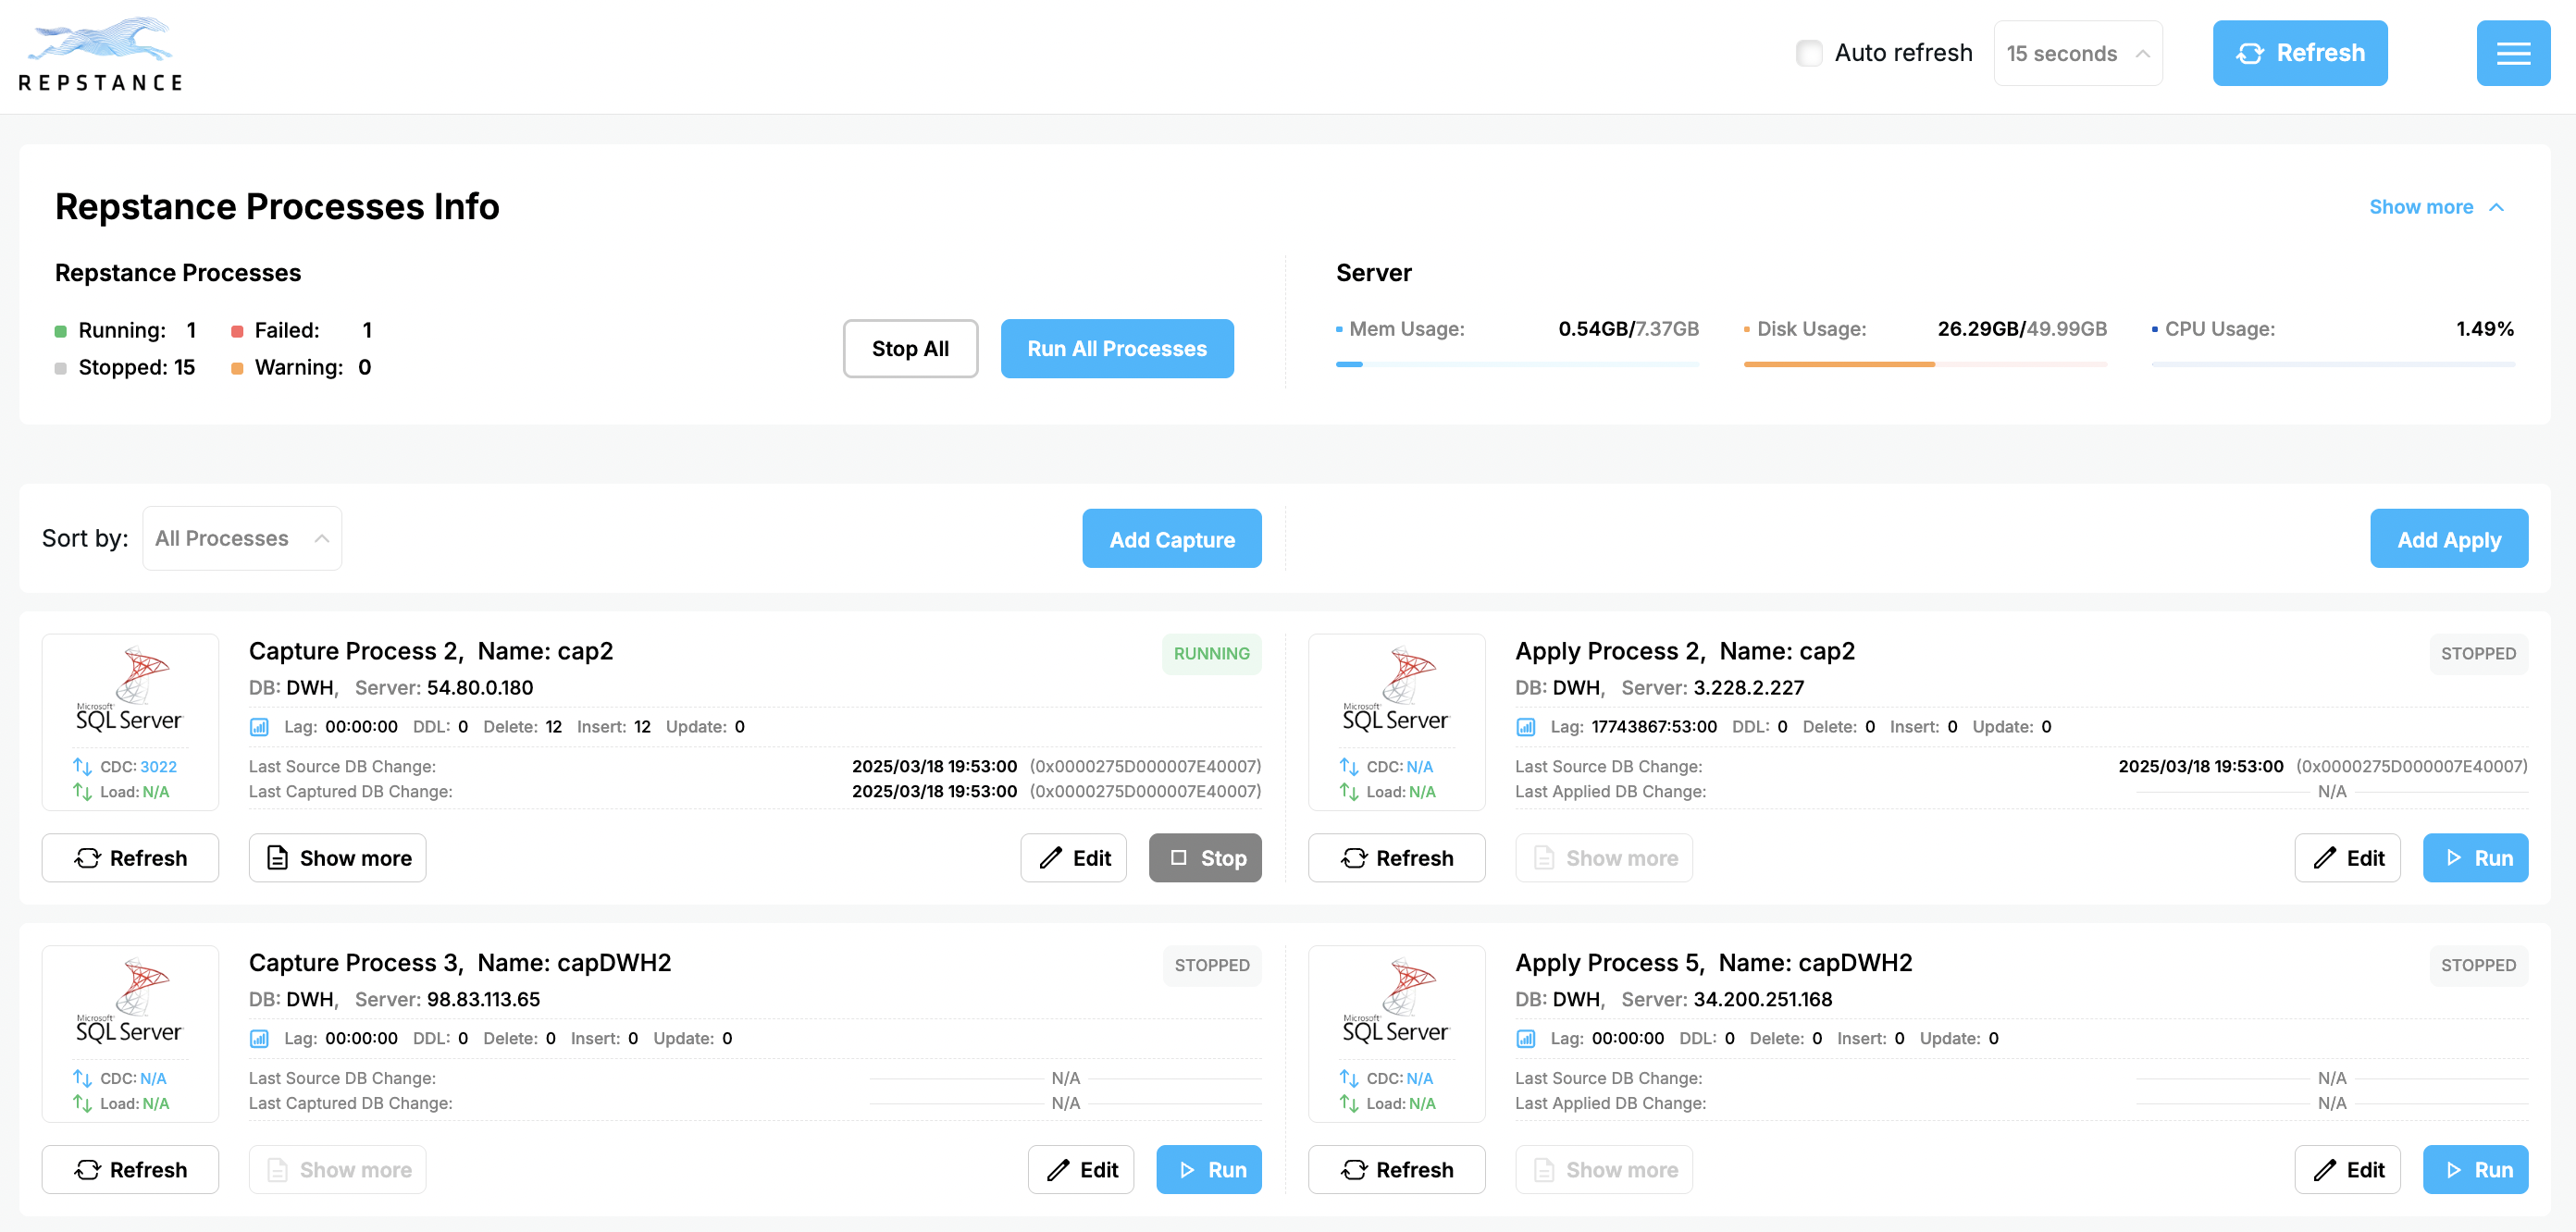
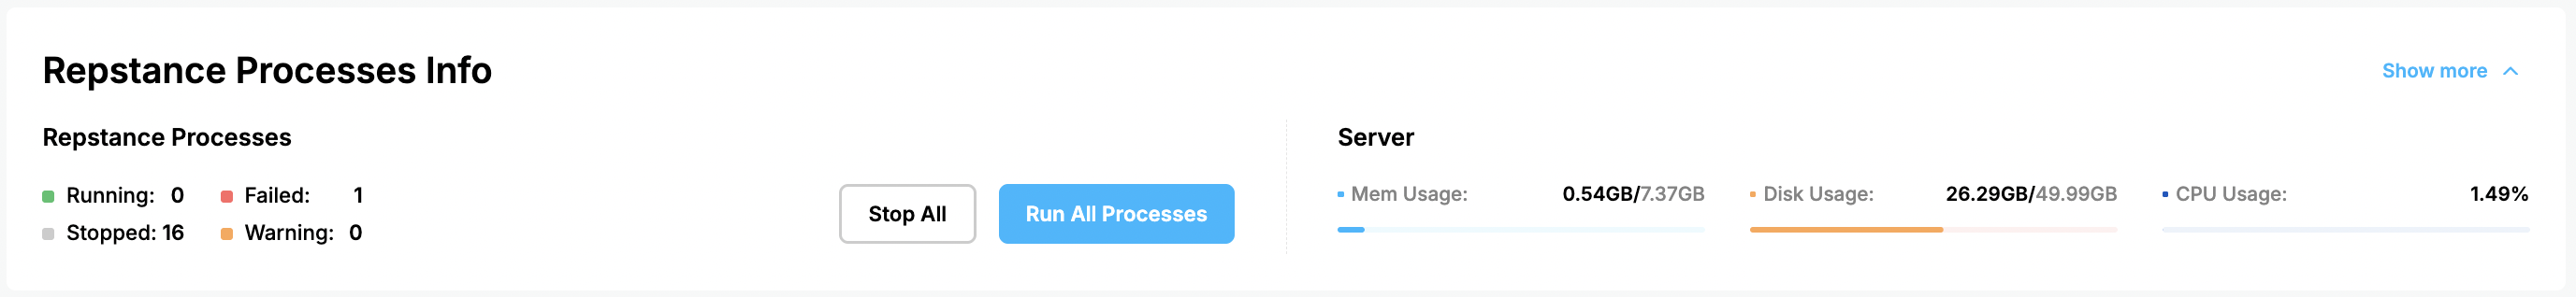
The overall status is shown on “Repstance Process Info” section:
On the main dashboard the following statistics are available:
- CDC, that is a Process Avarage Speed
- Load, that is Avarage Loading Speed
- Replication Lag and Replication Statistics
- The details on the Last Source LSN and Last Processed LSN
For detailed status of the process, hover on the process state

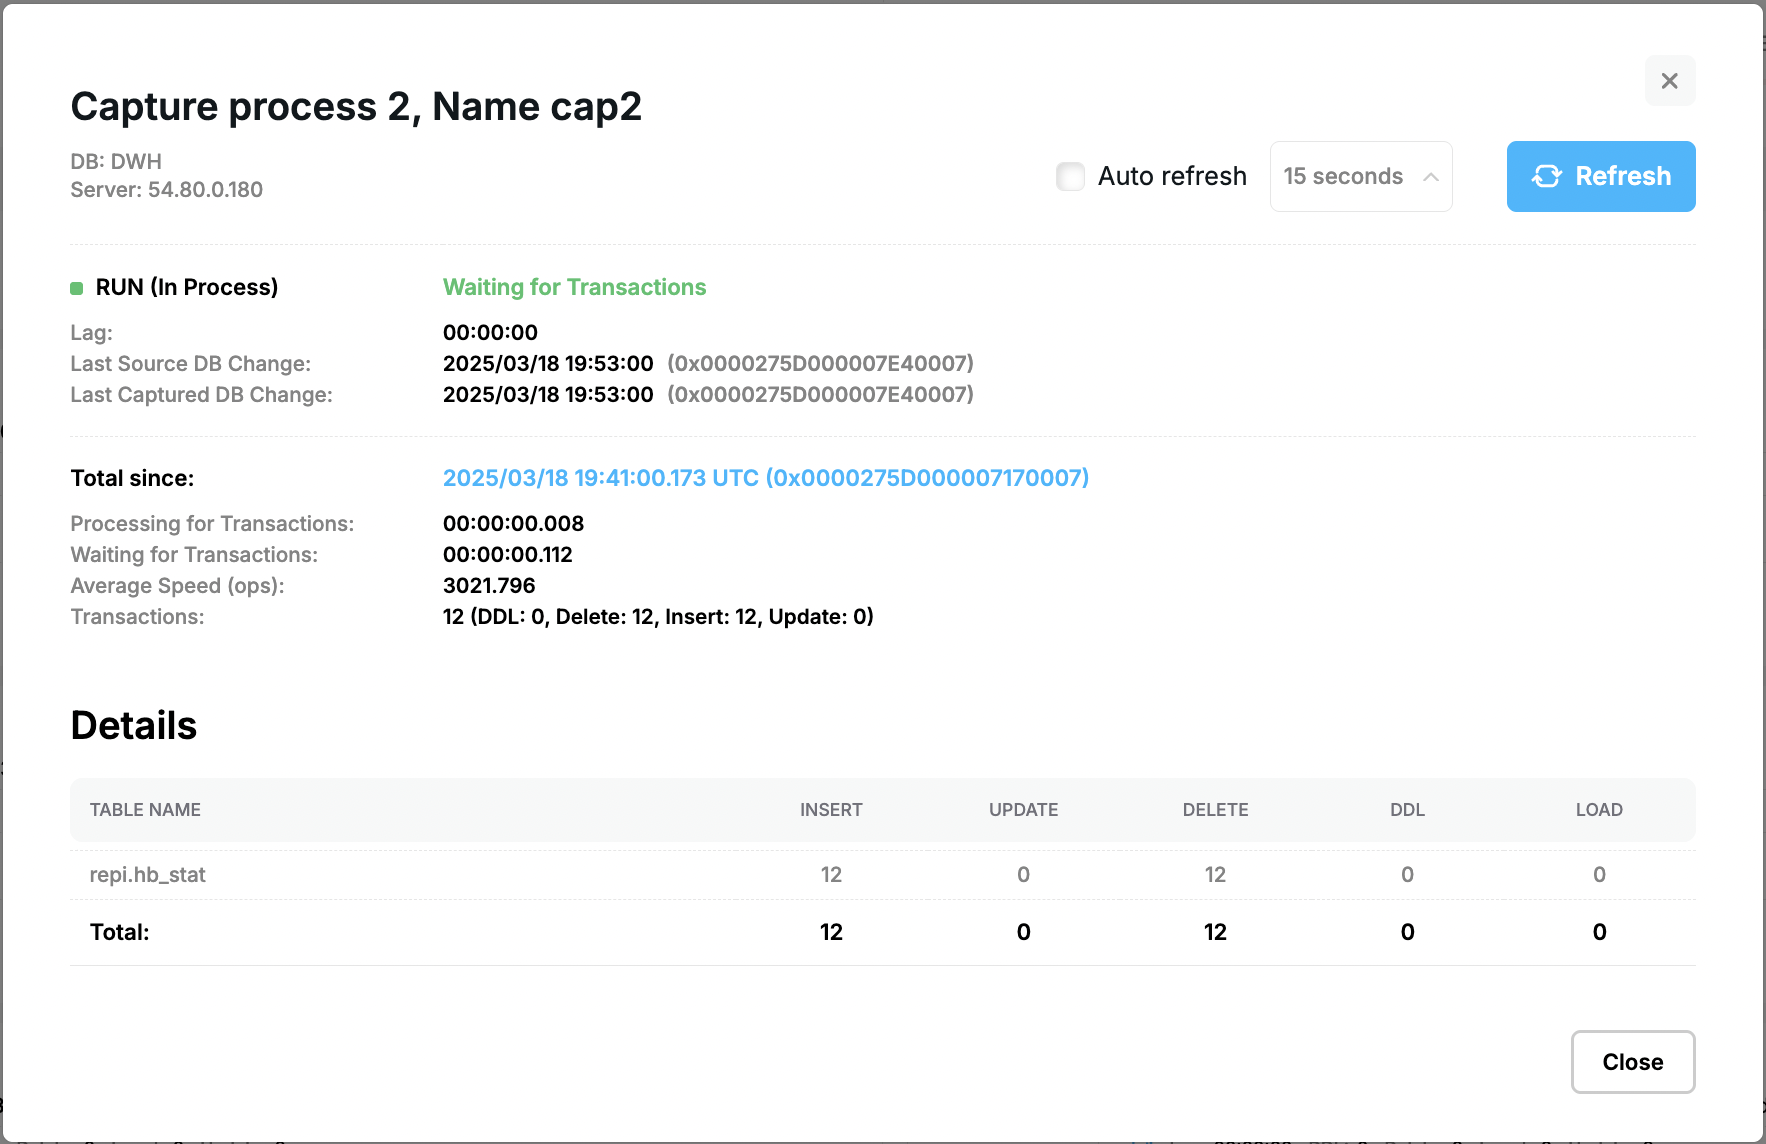
For the detailed statistics, click “Show more” on the individual process:
Prev page:
Stop any Capture or Apply ProcessesNext page:
Reset Apply Process- Repstance User Guide
- ABOUT REPSTANCE
- SUPPORTED DATABASE REQUIREMENTS
- GETTING STARTED WITH REPSTANCE
- INTERACTING WITH REPSTANCE SERVER
- CONFIGURE REPLICATION WITH REPSTANCE
- DATABASE CONFIGURATION COMMANDS
- PROCESS CONFIGURATION COMMANDS
- DATA COMPARISON
- REPSTANCE WEB USER INTERFACE
- REPSTANCE SERVER MAINTENANCE
- GLOSSARY